Appendix 3.3
Number of Claims Handled* by the Labour Relations Division from 2021 to 2025
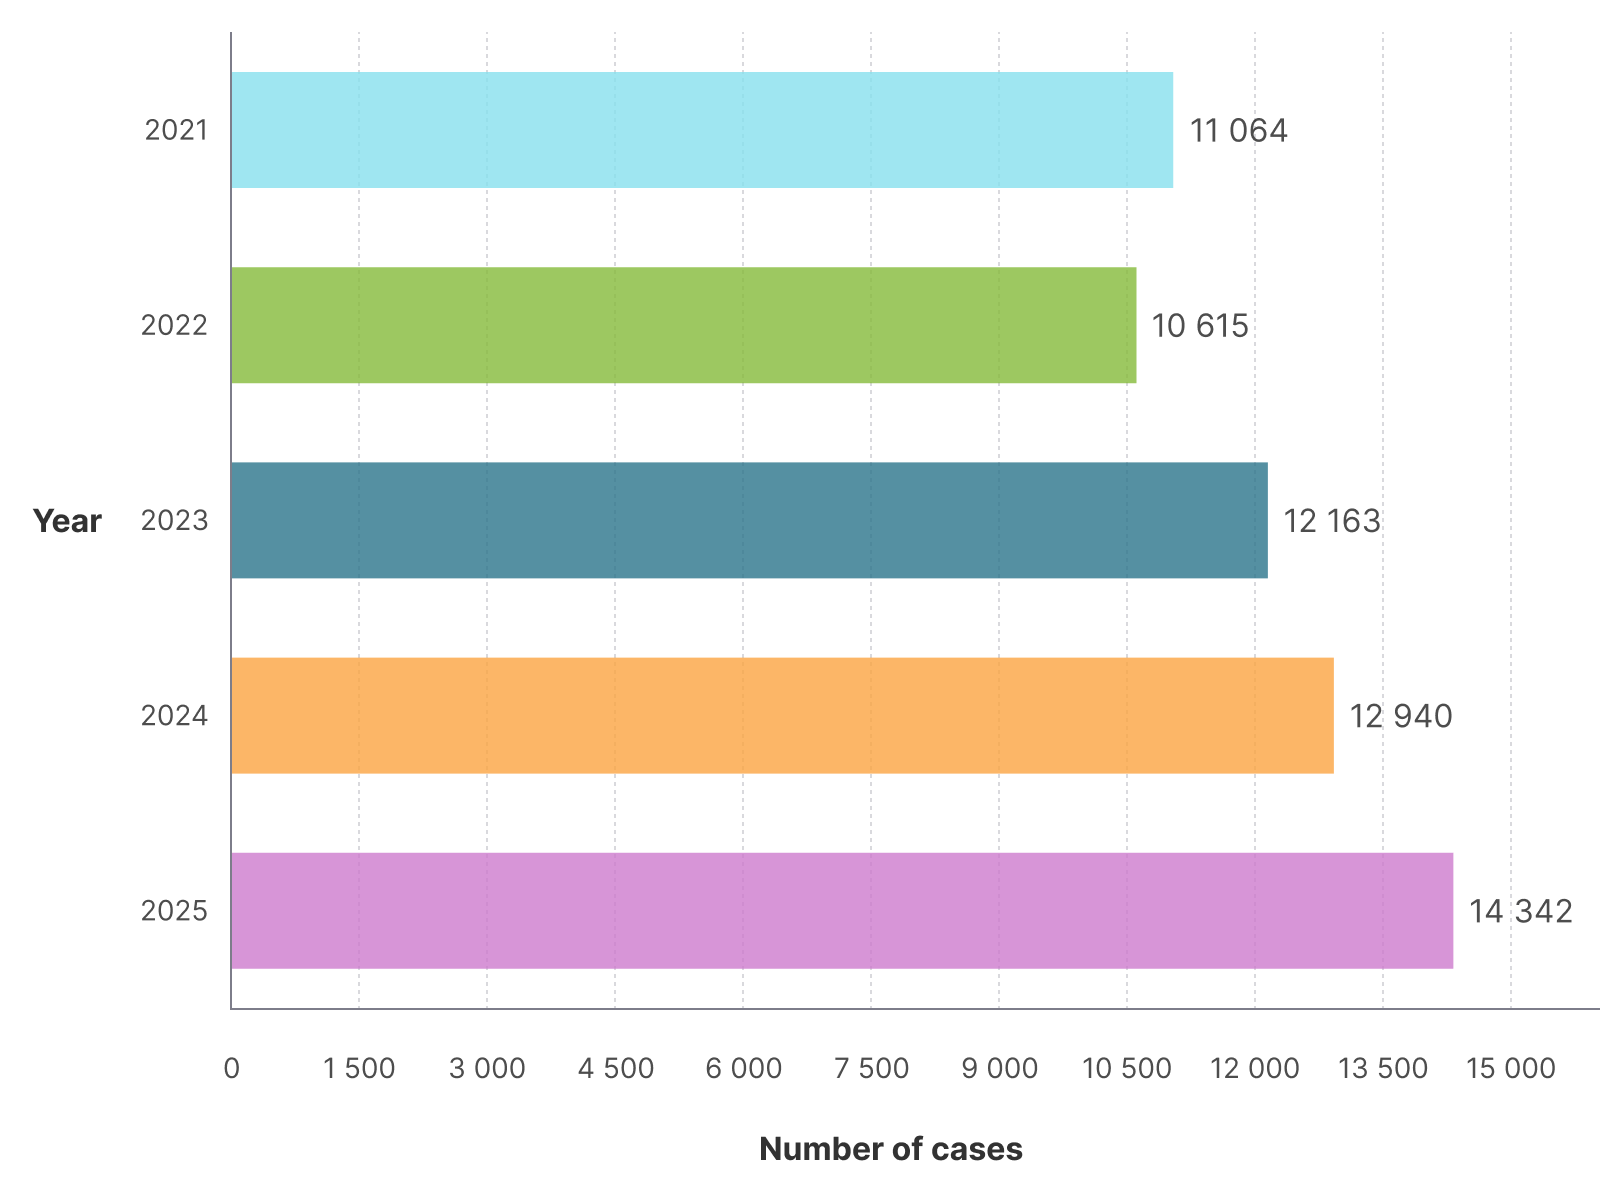
| Year | Number of cases |
|---|---|
| 2021 | 11 064 |
| 2022 | 10 615 |
| 2023 | 12 163 |
| 2024 | 12 940 |
| 2025 | 14 342 |
* Each claim involved 20 or less employees.
Appendix 3.3
| Year | Number of cases |
|---|---|
| 2021 | 11 064 |
| 2022 | 10 615 |
| 2023 | 12 163 |
| 2024 | 12 940 |
| 2025 | 14 342 |
* Each claim involved 20 or less employees.