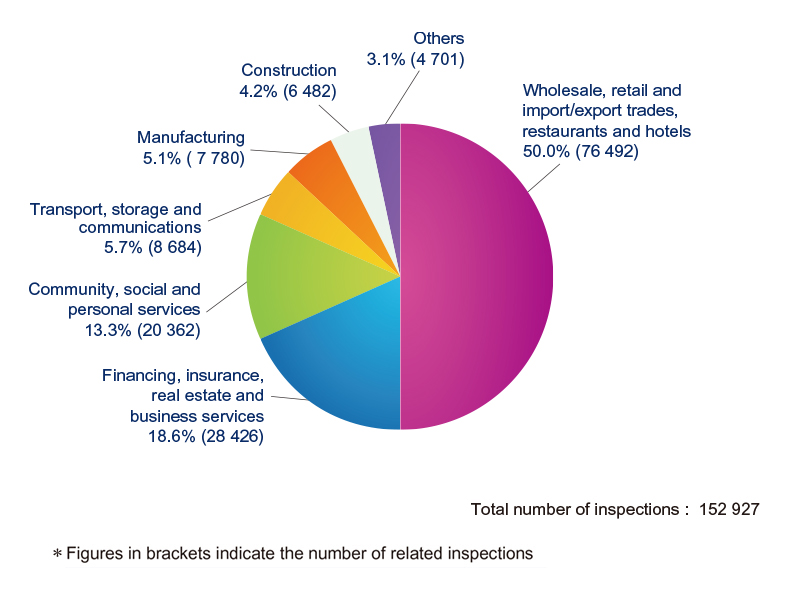
| Economic sector | Number of inspections |
Percentage |
|---|---|---|
| Wholesale, retail and import/export trades, restaurants and hotels | 76 492 | 50.0% |
| Financing, insurance, real estate and business services | 28 426 | 18.6% |
| Community, social and personal services | 20 362 | 13.3% |
|
Transport, storage and communications |
8 684 | 5.7% |
Manufacturing |
7 780 | 5.1% |
Construction |
6 482 | 4.2% |
Others |
4 701 | 3.1% |
| Total number of inspections | 152 927 |