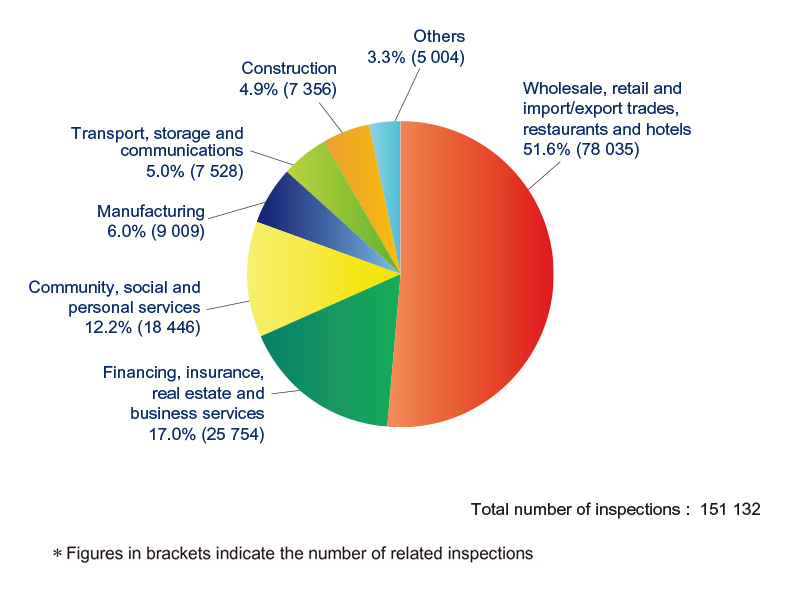

| Economic sector | Number of inspections |
Percentage |
|---|---|---|
| Wholesale, retail and import/export trades, restaurants and hotels | 78 035 | 51.6% |
| Financing, insurance, real estate and business services | 25 754 | 17.0% |
| Community, social and personal services | 18 446 | 12.2% |
|
Manufacturing |
9 009 | 6.0% |
Transport, storage and communications |
7 528 | 5.0% |
Construction |
7 356 | 4.9% |
Others |
5 004 | 3.3% |
| Total number of inspections | 151 132 | |